
Product Experience Management
We evaluate your digital product experience from your customers' perspective, using real users and real journeys to identify friction, opportunities, and moments that matter.
We evaluate your digital product experience from your customers' perspective, using real users and real journeys to identify friction, opportunities, and moments that matter.
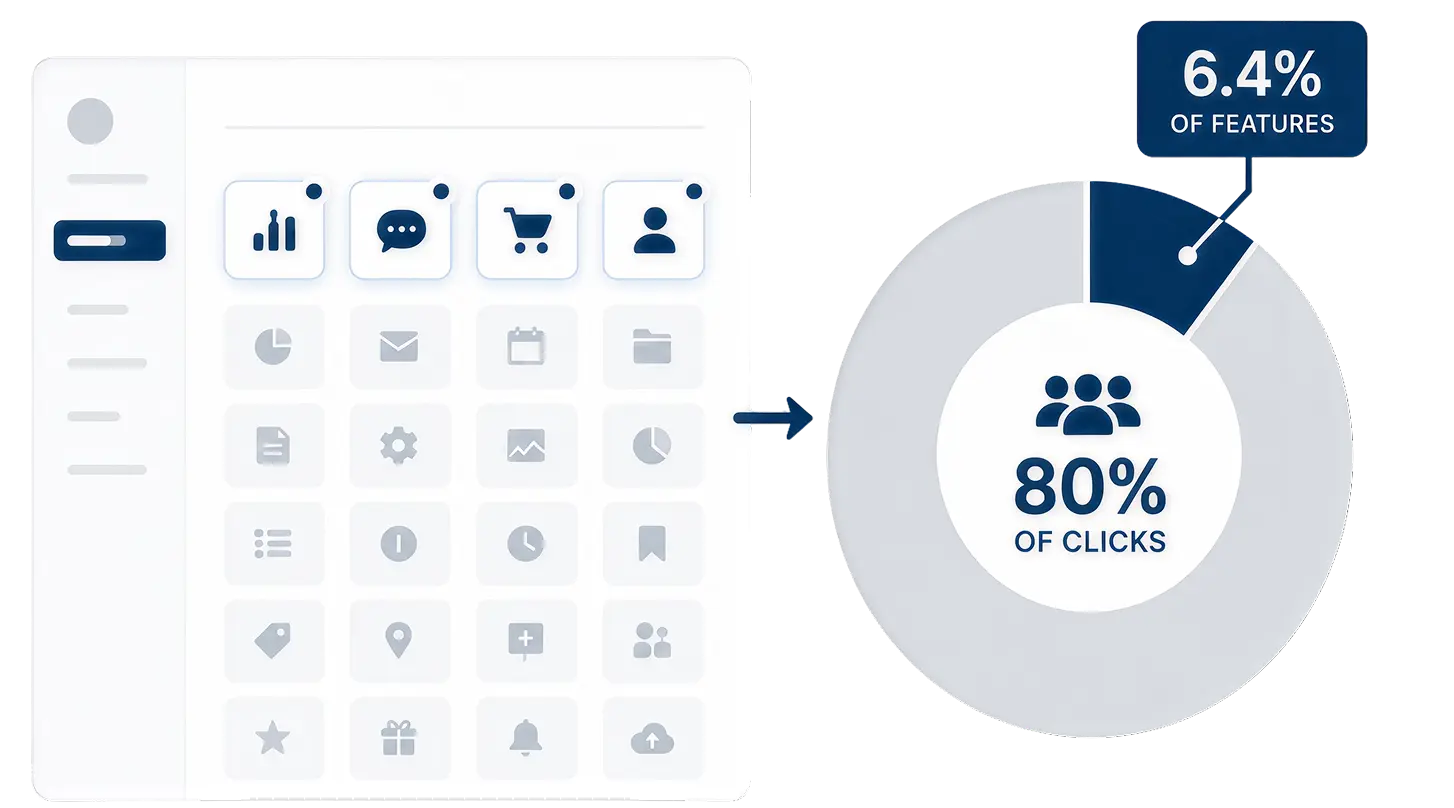
On average, just 6.4% of features on your digital product account for 80% of user clicks.
We revaluate every customer touchpoint on your digital products from your customer’s lens.
Map every touchpoint and interaction
Analyse customer effort, friction points and gaps
Gather customer insights on what creates value for them
Redesign the user journey wherever necessary
Work on the interface from a consumer's lense
Establish metrics and baselines
Track progress and impact
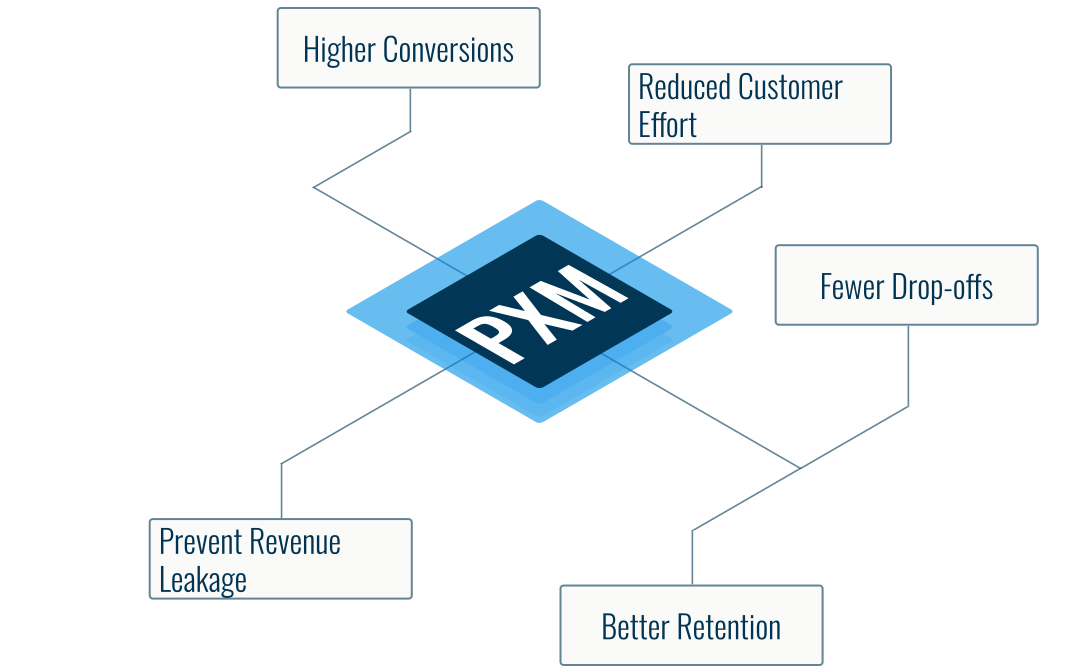

Read through case studies that show surprising insights about product experience
The question is whether it is shaping it positively or negatively. Let's uncover the moments that matter most.

WeWork Princeville, M/S Golf Link Software, Domlur, Bangalore, Karnataka,560071


